

Made by Dhawal Made by Dhawal

What Is the LCP Element? How the Browser Picks It

You can't fix your Largest Contentful Paint until you know which element the browser actually picked — and it's often not the hero image you've been optimizing. Here's how the browser really chooses your LCP element, the surprising exclusions that trip teams up, and how to find yours in the field.
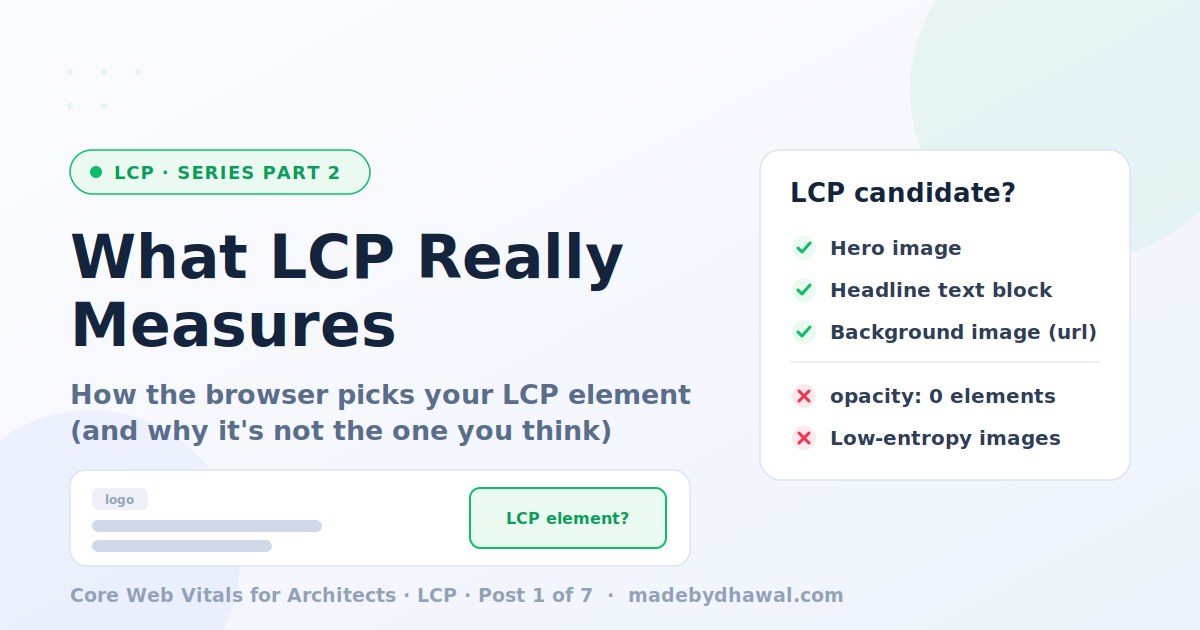
A few years ago I watched a capable team spend three sprints on their homepage hero image. New formats, a preload tag, CDN resizing — textbook work. Their LCP didn't move. When we finally pulled attribution data from the field, the LCP element for most users wasn't the hero at all. It was the cookie consent banner's headline text, rendering late because its script loaded late.

Three weeks of correct optimizations applied to the wrong element. That's the founding lesson of this series: you cannot optimize LCP until you know which element the browser picked — and it's often not the one you think.

The definition, precisely

LCP is the render time of the largest image, video poster frame, or text block visible in the viewport, measured from navigation start. Good is ≤ 2.5 seconds, poor is > 4.0 seconds — at the 75th percentile of field data. The nuance most people miss: LCP is a moving target during load. The browser emits a series of LCP candidates as progressively larger elements render — first a nav logo, then a headline, then a hero image. Only the final candidate before user interaction counts. Your LCP element can change based on what happens to load fastest, which is why it differs between users, devices, and cache states.

What counts — and the surprises

LCP measures when the biggest visible piece of content on the screen finishes loading. This could be:
  • A large image
  • An image inside an SVG graphic
  • A video's cover image (poster)
  • A background image used in a section of the page
  • A large block of text, like a headline or banner text
Now the surprises — the ones that cost teams weeks: Only the part you can actually see matters:  If a large image is only half visible when the page first opens, only the visible half is considered. Example: Imagine a banner image that's 1,000 pixels tall, but only the top 400 pixels are visible without scrolling. The browser only counts those 400 pixels. A smaller image that's fully visible might end up being the LCP instead. Hidden content doesn't count: If something is invisible (for example, because it's temporarily hidden while another 3rd party is loading), it isn't counted as LCP. I've seen this single pattern add two seconds to p75 LCP. Example: Some websites hide the page for a second while they decide which version of the page to show for an A/B test. During that time, the main content is invisible. LCP won't happen until the page becomes visible, making the website appear slower. Blurry or placeholder images don't count: Many websites first show a blurry or simple placeholder image while the real image is loading. The browser knows the difference and ignores these placeholders. Example: A blurred hero image appears instantly, but the sharp version loads 1 second later. The blurry version isn't counted. The timer waits for the real image. Content that disappears can still be counted: Sometimes a large loading screen, skeleton placeholder, or splash screen appears first and is removed a moment later. If it was the largest visible thing when it appeared, the browser may still record it as the LCP—even though users didn't spend much time looking at it. Example: A website shows a large loading placeholder for half a second before replacing it with the real content. The placeholder might still become the recorded LCP, giving a misleading impression of what users actually experienced.

Finding YOUR element

In the lab: DevTools Performance panel, record a load, click the LCP marker — the element highlights. Lighthouse lists it under diagnostics. But here's the trap: your lab LCP element is frequently not your field LCP element. Different viewport sizes, logged-in states, ads, personalization, cache states. The lab shows you one movie frame; the field is the whole distribution. The real answer is the attribution build of the web-vitals library:
JavaScript
import { onLCP } from 'web-vitals/attribution';
onLCP(({ value, attribution }) => {
 sendToAnalytics({
 metric: 'LCP',
 value,
 element: attribution.element,  // e.g. "div#hero > img"
 url: attribution.url, // resource URL if it's an image
 });
});
Fifteen lines of plumbing later, you can chart the distribution of LCP elements across real traffic. On one project this revealed: 60% hero image, 25% headline text (font-blocked), 15% an ad slot. Three different problems, three different fixes — and no single "optimize the hero" sprint could have solved more than the first.

Why this is an architecture question

The LCP element is a design decision surface: your templates decide what's largest above the fold. Element type dictates strategy — image LCP is a resource-loading problem, text LCP is a font problem, embed LCP is a third-party governance problem. We'll cover each in this series. One honest warning: once teams learn the element matters, someone proposes shrinking it so a faster element wins the candidacy. Occasionally that's legitimate design simplification. Usually it's Goodhart's law — hitting the metric while missing the point. Your users still wait for the content they came for; you've just stopped measuring it.

Your homework

Before next  post: instrument attribution, collect a few days of field data, and answer three questions. What is your p75 LCP? Which element is it, most often? Does your lab element match your field element? If that last answer is no, you already know why your past perf sprints didn't move the needle.
Next week: knowing the element is half the diagnosis. The other half is knowing where its time went — and LCP time hides in exactly four places. Most teams instinctively optimize phase three when their problem lives in phase two. I'll show you how to read the breakdown in five minutes flat.