
Part 1.1: The Four Phases of LCP: Where Your Time Actually Goes
Every slow LCP is slow in one of four places — and most teams expertly optimize the phase that was never the problem. One retail site had a backlog full of image-compression tickets when the real fix recovered 1.8 seconds and recompressed nothing. Here's how to read the four phases in five minutes.
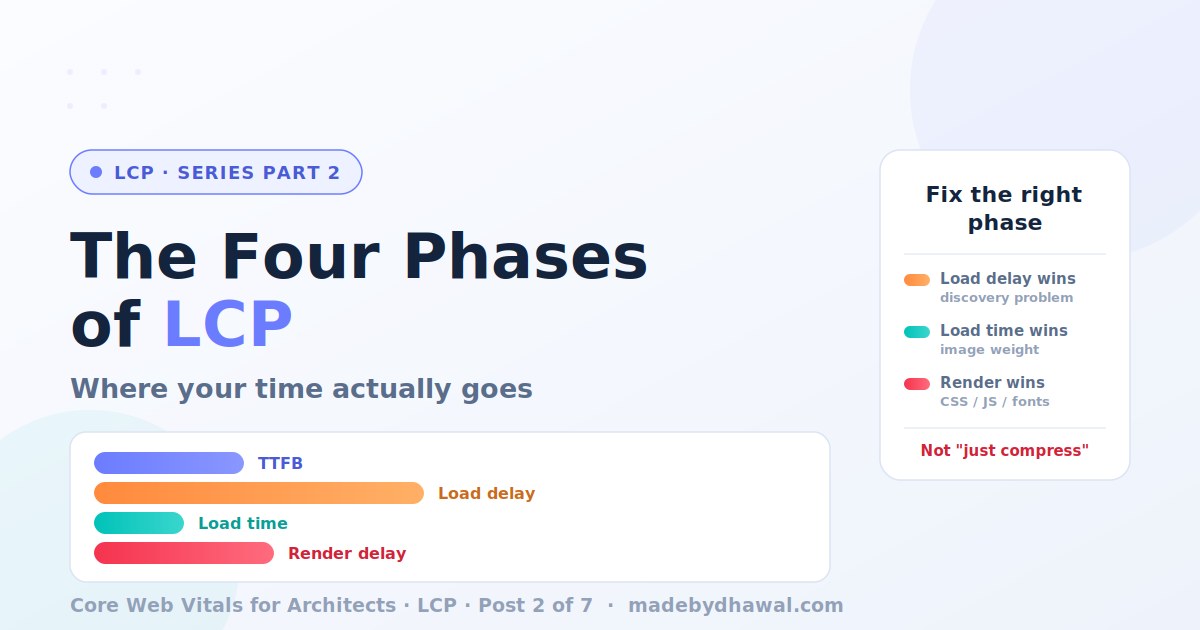
Every slow LCP is slow in one of four specific places. Until you know which one, you're guessing — and in my experience reviewing this stuff, the most common failure isn't bad optimization. It's excellent optimization aimed at a phase that was never the problem.
The four phases
For an image LCP, the total splits into:
- TTFB — navigation start to the first byte of HTML. Nothing client-side happens before this.
- Resource load delay — first byte to when the browser starts downloading the image. This is discovery time: how long the image stayed hidden from the browser.
- Resource load time — the actual download.
- Element render delay — download done to pixels on screen. Time lost to render-blocking CSS or JS, or the element not being in the DOM yet.
Text LCP doesn't have the resource phases the same way, but render delay dominated by font loading plays the same role. That's Post 4.
The part that surprises people
Ask engineers where LCP time goes and most say "the download" — big images, slow networks. The field data across the industry says otherwise. Load delay and render delay routinely dwarf load time. The image often downloads in 300ms but sat around for 1.5 seconds waiting to be discovered, or finished downloading and then waited on a JS bundle to stop blocking the render.
This is why "just compress your images" is the most over-prescribed and least effective LCP advice going. Compression attacks phase 3. Your problem is almost always phase 2 or 4.
Reading it
The attribution build hands you the phases per real user:
import { onLCP } from 'web-vitals/attribution';
onLCP(({ attribution }) => {
  const { timeToFirstByte, resourceLoadDelay, resourceLoadDuration, elementRenderDelay } = attribution;
  sendToAnalytics({ timeToFirstByte, resourceLoadDelay, resourceLoadDuration, elementRenderDelay });
});
Chart the p75 of each. Five minutes later you've got a diagnosis that ends most of the arguments in your planning meetings.
The decision tree
TTFB dominates (over ~800ms): your problem is below the frontend — server time, no CDN cache, redirect chains. Frontend fixes are deck chairs. Go read the TTFB series.
Load delay dominates: a discovery problem. The image is hidden from the preload scanner — injected by JS, buried in a CSS background, lazy-loaded above the fold, or rendered client-side so the browser can't see it until the framework boots. Fixes: get it into server HTML, fetchpriority="high", preload as a last resort.
Load time dominates: now it's an image-weight problem. Formats, responsive sizing, CDN.
Render delay dominates: the image showed up and waited. Render-blocking CSS/JS, or fonts for text. Also the signature of client-side rendering — nothing paints till the bundle runs.
A real one
Retail site I audited: p75 LCP of 4.1s, broken down as TTFB 0.6, load delay 2.2, load time 0.4, render delay 0.9. Their backlog was full of image-compression tickets — phase 3, the smallest slice. The actual cause? The hero was rendered client-side from an API response, invisible to the browser until hydration. Moving it into the server HTML with fetchpriority="high" cut load delay by 1.8 seconds. Nobody recompressed a single image.
The phase breakdown didn't just find the fix. It killed a quarter of well-meaning wrong work.
New to this series?
Core Web Vitals for Architects · LCP · Post 2 of 7
New here? Start with the series intro, or read Part 1: What LCP Really Measures first.
← Previous: What LCP Really Measures
→ Up next: Image LCP: Priority, Preload & Formats — the one attribute that cuts a second off image LCP.